Data is part of everything that a business involves. Employing a data-driven approach can strengthen a business’ marketing efforts by shortening the buying cycle, boosting customer lifetime value, and increasing ROI. Data is behind every little detail and process, which means that any growth strategy cannot exist without a strong data foundation. In a growth strategy, data can minimize the guessing game, ensuring informed decisions.
Marketers need to know the exact data that is to be collected, and the outcome to expect out of it. It is also important to have the right set of tools to collect the data needed, put it up on the dashboard, and monitor it simultaneously. There are a lot many tools available, out of which Google Analytics is seen to be the most reliable and popular one.
Google Analytics brings life to web traffic!
Google Analytics is the undisputed king of Web analysis features, with more than 85% of website owners using the tool to track their Web traffic. That’s because this tool brings loads of Web traffic and user engagement analysis, offering ultra-precise information about the wants, needs, and behaviours of the visitors and users. It provides data from a website or app on engagement, conversions, and transactions. However, many online merchants need data from other sources, like search engines, social media, and more. Some sources can be connected or imported into Google Analytics, while others cannot. For instance, advertising data, social media data, organic search data, and affiliate marketing data can be connected or imported, but online sales, cancelled orders, and refunds reporting may be unavailable or limited. There are many alternatives that can thus be used for joining Google Analytics with other such sources; one of the best ones being Google Data Studio!
What is Google Data Studio?
Part of the Google marketing platform, Google Data Studio is an online tool that helps to convert data into customizable informative reports and dashboards. It is a tool that has been in used ever since Google introduced it in the year 2016, on 15th March, as part of the enterprise Google Analytics 360 suite. Then later in the month of May, the search engine giant announced a free version of Google Data Studio for individuals and small teams.
What all can you do with Google Data Studio?
With Google Data Studio, you can easily report on data from a wide variety of sources, without any programming. This makes it absolutely easy to use, and convenient to share your insights with individuals and teams across the world. You can tell your data stories as broadly as you wish to, by embedding your reports in other pages like Google sites, blog posts, annual reports, and marketing articles. You can then invite any individual or team, or send them links, to view as well as edit your reports. Let’s look in detail as to what all Google Data Studio can help you to do.
Visualize your data through highly-configurable tables and charts
Google Data Studio comes with a drag and drop report editor tool which helps you to tell your data story with charts, pie charts, geo maps, bubble graphs, data tables, and a lot more. All of this can be enhanced with your preferred styles and colour themes to make your data story a work of data visualized art! You can also make your reports interactive with viewer filter and data range controls, which can turn any report into a flexible template report that anyone can use to see their own data. You can also include links and clickable images to create product catalogues, hyperlinked content, and video libraries. All in all, with Google Data Studio, you can turn your data into appealing and informative art that is easy to reach and share.
Easily connect to a variety of data sources
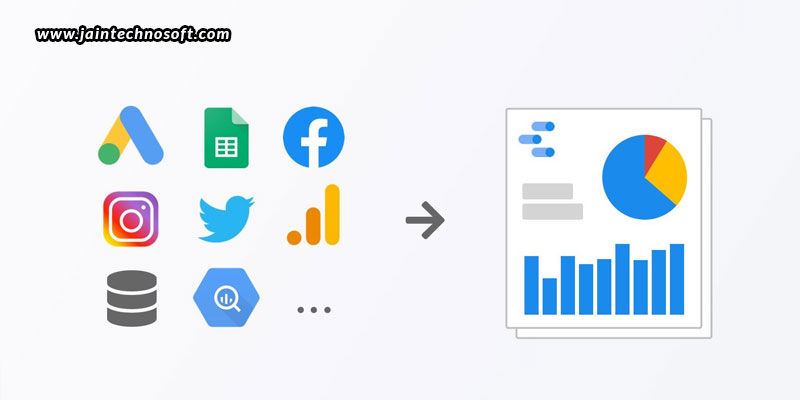
As we mentioned above, with Google Data Studio, you can easily report on data from a wide variety of sources, without any programming. This allows you to connect to data sets in just a matter of seconds! Some of the most popular data sets you can connect to include –
- Google Marketing Platform products (like Google Analytics, Google Ads, Display & Video 360, Search Ads 360)
- Google consumer products (like Search Console, Sheets, and YouTube)
- Databases (like BigQuery, MySQL, and PostgreSQL)
- Social media platforms (like Facebook, Twitter, and Reddit)
- Flat files via CSV file upload and Google Cloud Storage
Share your insights with the world and collaborate on the reports
Google Data Studio makes it easy to share your insights with anyone you want to, individuals or teams, across the world. You can invite anyone you wish to, to view and edit your reports. You can also send them links in scheduled emails. Moreover, sharing a Google Data Studio file with another editor can help in working real time as a team.
When you want to use Google Data Studio…
When you want to use Google Data Studio, there are quite a few things you’ll need, to view, create, and share your files. To only view a Google Data Studio report, you’ll need only a supporting browser (Chrome, Firefox, or Safari) and an internet connection; no Google account will be required. But, to create and edit reports, you’ll need a Google account, and also know how to map a non-Gmail address to a Google account. Also, you’ll need to accept the Google Data Studio terms of service and policies. But, all this can be possible only if you belong to one of the supported countries on the list of where Google Data Studio can be used (any country other than China, Iran, Iraq, North Korea, Syria, Cuba, and Crimea).
How do you create a report in Google Data Studio?
- You first start with creating a report. When you sign in to Google Data Studio, you’ll see the home page with the Reports tab, where you can begin with a new blank report, or a pre-built report template.
- Once you select the kind of report you want to build, you will then be asked to add your data. Here, you can add an existing data source, or create a new one, as you wish.
- Then, using the menus and toolbar, you can add components to the report canvas – with various style options and controls that you can choose from.
- Finally, you get to view your report, just like how other viewers will be able to see it.
- Once you’re satisfied with it, you can move ahead to share your report with other viewers. You can also share the data source, to let other people create their own reports based on your data source.
Google Data Studio is currently available in 37 languages, and supports number, date, and time formats in those languages. It can also handle 59 international currencies. So, if you belong to one of the supporting companies on Google Data Studio’s list, set your Google account language preference to whatever language you wish, and “Get-Set-Go” with Google Data Studio!
** A Special Update**
Recently, Backtracks, a technology infrastructure platform for end-to-end podcast management, advertising, and data analytics, announced a new collaboration with Google Cloud and Google Data Studio. This collaboration can now allow users to reach new levels of data visibility across multiple data sources. Publishers, advertisers, and SEO company in Bangalore will now be able to build custom reports and dashboards for their podcast analytics and advertising data.